Modulation Transfer Function or "MTF" is a measurement of the optical performance potential of a lens. MTF charts can give you a better understanding of the optical quality of various NIKKOR lenses and can be useful references when researching and comparing a lens. MTF charts can be found on the web pages dedicated to each NIKKOR lens on the Nikon Global website.
An MTF chart plots the contrast and resolution of a lens from the center to its edges against a "perfect" lens that would transmit 100% of the light that passes through it. The contrast of a lens is important as this works in correlation to lens resolution.
Using an MTF chart is the preferred method for studying lens optical performance as they use theoretical equations to plot a performance graph and don't rely on subjective opinion, subject matter, camera features, software, or other factors.
The y-axis (vertical axis) of an MTF chart plots the transmission of light through the lens with a maximum value of "1.0" which would indicate 100% transmittance of the light, although 100% transmittance of light is not possible because glass is not 100% transparent.
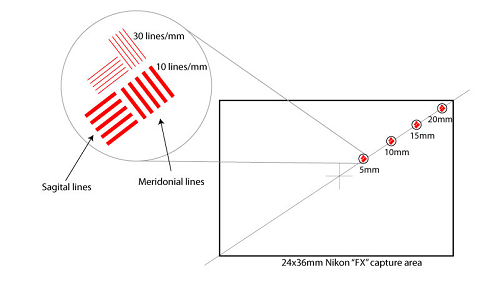
The x-axis (horizontal axis) shows the distance from the center of the image towards its edges. So, the "0" in the lower left corner represents the center of the lens and the numbers along the lower axis represent the distance out towards the edge of the lens in millimeters.
How to read an MTF chart
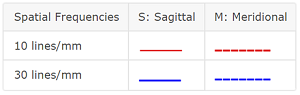
There are two groups of data plotted on a Nikon MTF chart: Sagital and Meridonial lines.
"Sagital lines" (the solid lines) represent the contrast measurements of pairs of lines that run parallel to a central diagonal line that passes through the middle of the lens from the bottom left-hand corner to the top right-hand corner.
"Meridonial lines" (the dotted lines) represent line pairs also positioned along an imaginary line from the center of a lens to the edge but these line pairs are perpendicular to the diagonal line.
There are two groups of test lines for each Sagital and Meridonial value: one group or line pairs at 10 lines per millimeter and a second group at 30 lines per millimeter. The lower line pairs (10 lines/mm) will generally be plotted higher on the graph than the more challenging fine resolution 30 lines/mm.
In general, the higher and flatter the lines the better. Higher lines indicate better contrast (10 lines/mm) or resolution (30 lines/mm) while a flatter (left to right) line shows that the optical performance is close to the same at the edge of the image compared to the center.
Below is an MTF chart for the NIKKOR Z 35mm f/1.8 S lens. When measuring a lens' performance for an MTF chart, Nikon tests are carried out with the lens at its maximum (widest) aperture. The contrast of the Sagital and Meridonial line pairs at various points from the lens' center are read and plotted on the chart.
The MTF chart consists of measurements for the Sagital and Meridonial lines at both 10 lines per millimeter and 30 lines per millimeter. This produces a chart with 4 separate lines.
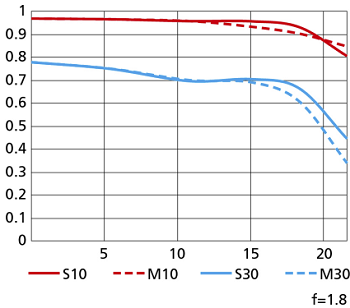
The red 10 line/mm (10 lines per millimeter) indicates the lens' ability to reproduce low spatial frequency or low resolution. This line indicates the lens' contrast values and the higher and straighter this line is the better; because the higher the line appears the greater the amount of contrast the lens can reproduce. The blue 30 line/mm (30 lines per millimeter) indicates the lens' ability to reproduce higher spatial frequency or higher resolution; this line relates to the resolving power of the lens and again the higher the line the better.
The line starts on the left of the chart which represents the center of the lens. As the line moves to the right it indicates the edge of the lens, so you can see how the contrast and sharpness of the lens changes from the center to the edge of the image.
Using MTF charts to determine the bokeh effect of the lens
Another lens characteristic that can be read from the MTF graph is the bokeh of the lens. Bokeh is a term used to describe the blurring or hazing effect in the out-of-focus areas of a photographic image (for more information please read our “What is Bokeh?” article here). The bokeh effect varies between lenses and the effect is influenced by the quality of the lens elements used and the number of aperture blades in the lens design (more blades produce a better circle and therefore a better bokeh effect). The closer the solid line and the dotted line are together, the softer the out-of-focus effect will be on a particular lens.
Lens performance
While an MTF chart can be used to compare two similar lenses from the same manufacturer it can be difficult to compare across different manufacturers due to testing and display differences. Further, an MTF chart measures the theoretical optical performance of a lens only. Many factors (camera imaging sensor, camera software settings, filters, subject matter, subject/camera motion, etc.) can greatly affect the final image quality so MTF charts should only be used as a starting point when comparing and purchasing a lens. It’s also worth noting that there are other aberrations not represented in an MTF chart, for example, linear distortion (curvature of straight lines), chromatic aberrations, lens flare, vignetting (light fall-off at the edges of an image). Other factors should also be considered when planning a purchase, such as size, weight, portability, handling, close focusing distance and Vibration Reduction.